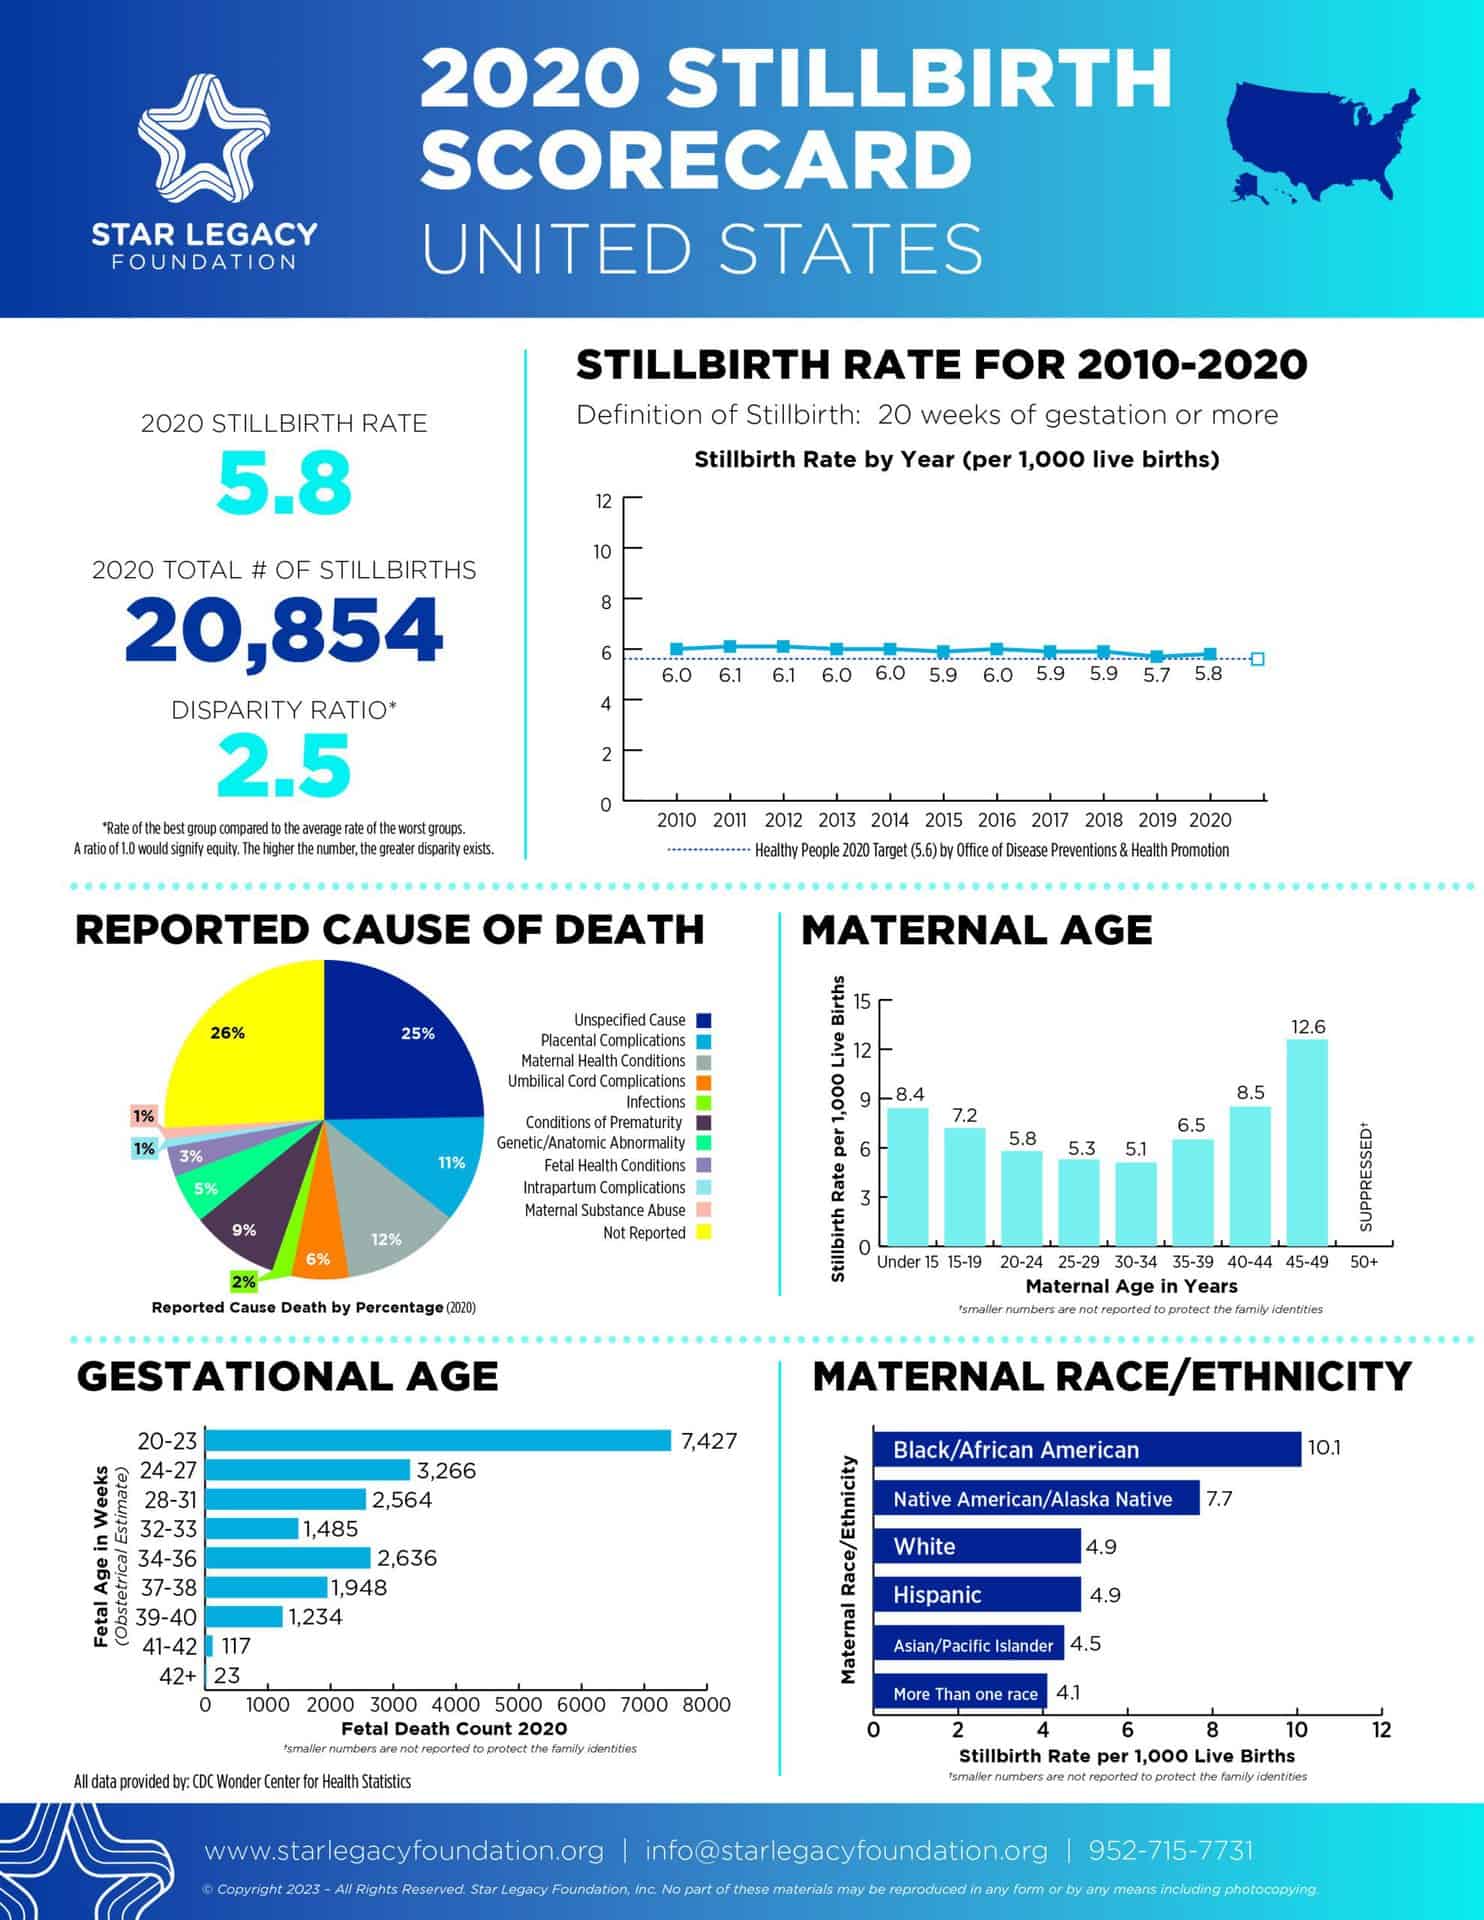
Stillbirth in the United States is most commonly defined as a fetal death occurring at 20 weeks or more gestation. In 2020, 20,854 babies were stillborn across the US. This is more than deaths due to SIDS and prematurity combined. That number also represents roughly one quarter of all stillbirths occurring in high-income countries around the world. Unfortunately, the majority of these families will never know what caused their baby’s death.
The stillbirth rate in the United States has remained largely unchanged for several decades and is higher than many comparable countries around the world. During the years 2000 – 2015, the US had the second to lowest Annual Rate of Reduction for stillbirth out of 49 high-resource nations. The top 5 nations had a reduction rate more than 10 times the US reduction rate of 0.4%.
The emotional, financial, and physical impact on families and society has been well-documented. Yet, the Lancet medical journal has called stillbirth “the most under-studied issue in medicine today.”
The World Health Organization recently recognized the importance of fetal deaths as an indicator of global health by including fetal death rate targets for the first time in their Every Newborn Action Plan published in 2014.
Stigma, lack of awareness, and fatalism have been identified as significant barriers to stillbirth prevention and bereavement support. Adding to the issue, as noted by the Lancet Executive Summary, is that ‘no one organization takes responsibility for stillbirth.’
The Stillbirth Scorecard is designed to bring stillbirth out of the shadows and raise our collective awareness about the number of families being impacted by these deaths every day. We must first understand the problem before we can fix it.
The first step in this process is to understand the current status of stillbirth in the United States and in each state. The documents presented here look at some key indicators of this status.
Next steps in this effort will look at other factors that provide more information about the efforts to improve stillbirth prevention and bereavement care. Examples may include the availability of a Certificate of Birth Resulting in Stillbirth, a Stillbirth Tax Credit, bereavement or support services, and more. We will also be looking into more specific opportunities for improvement and highlight action items needed for progress.
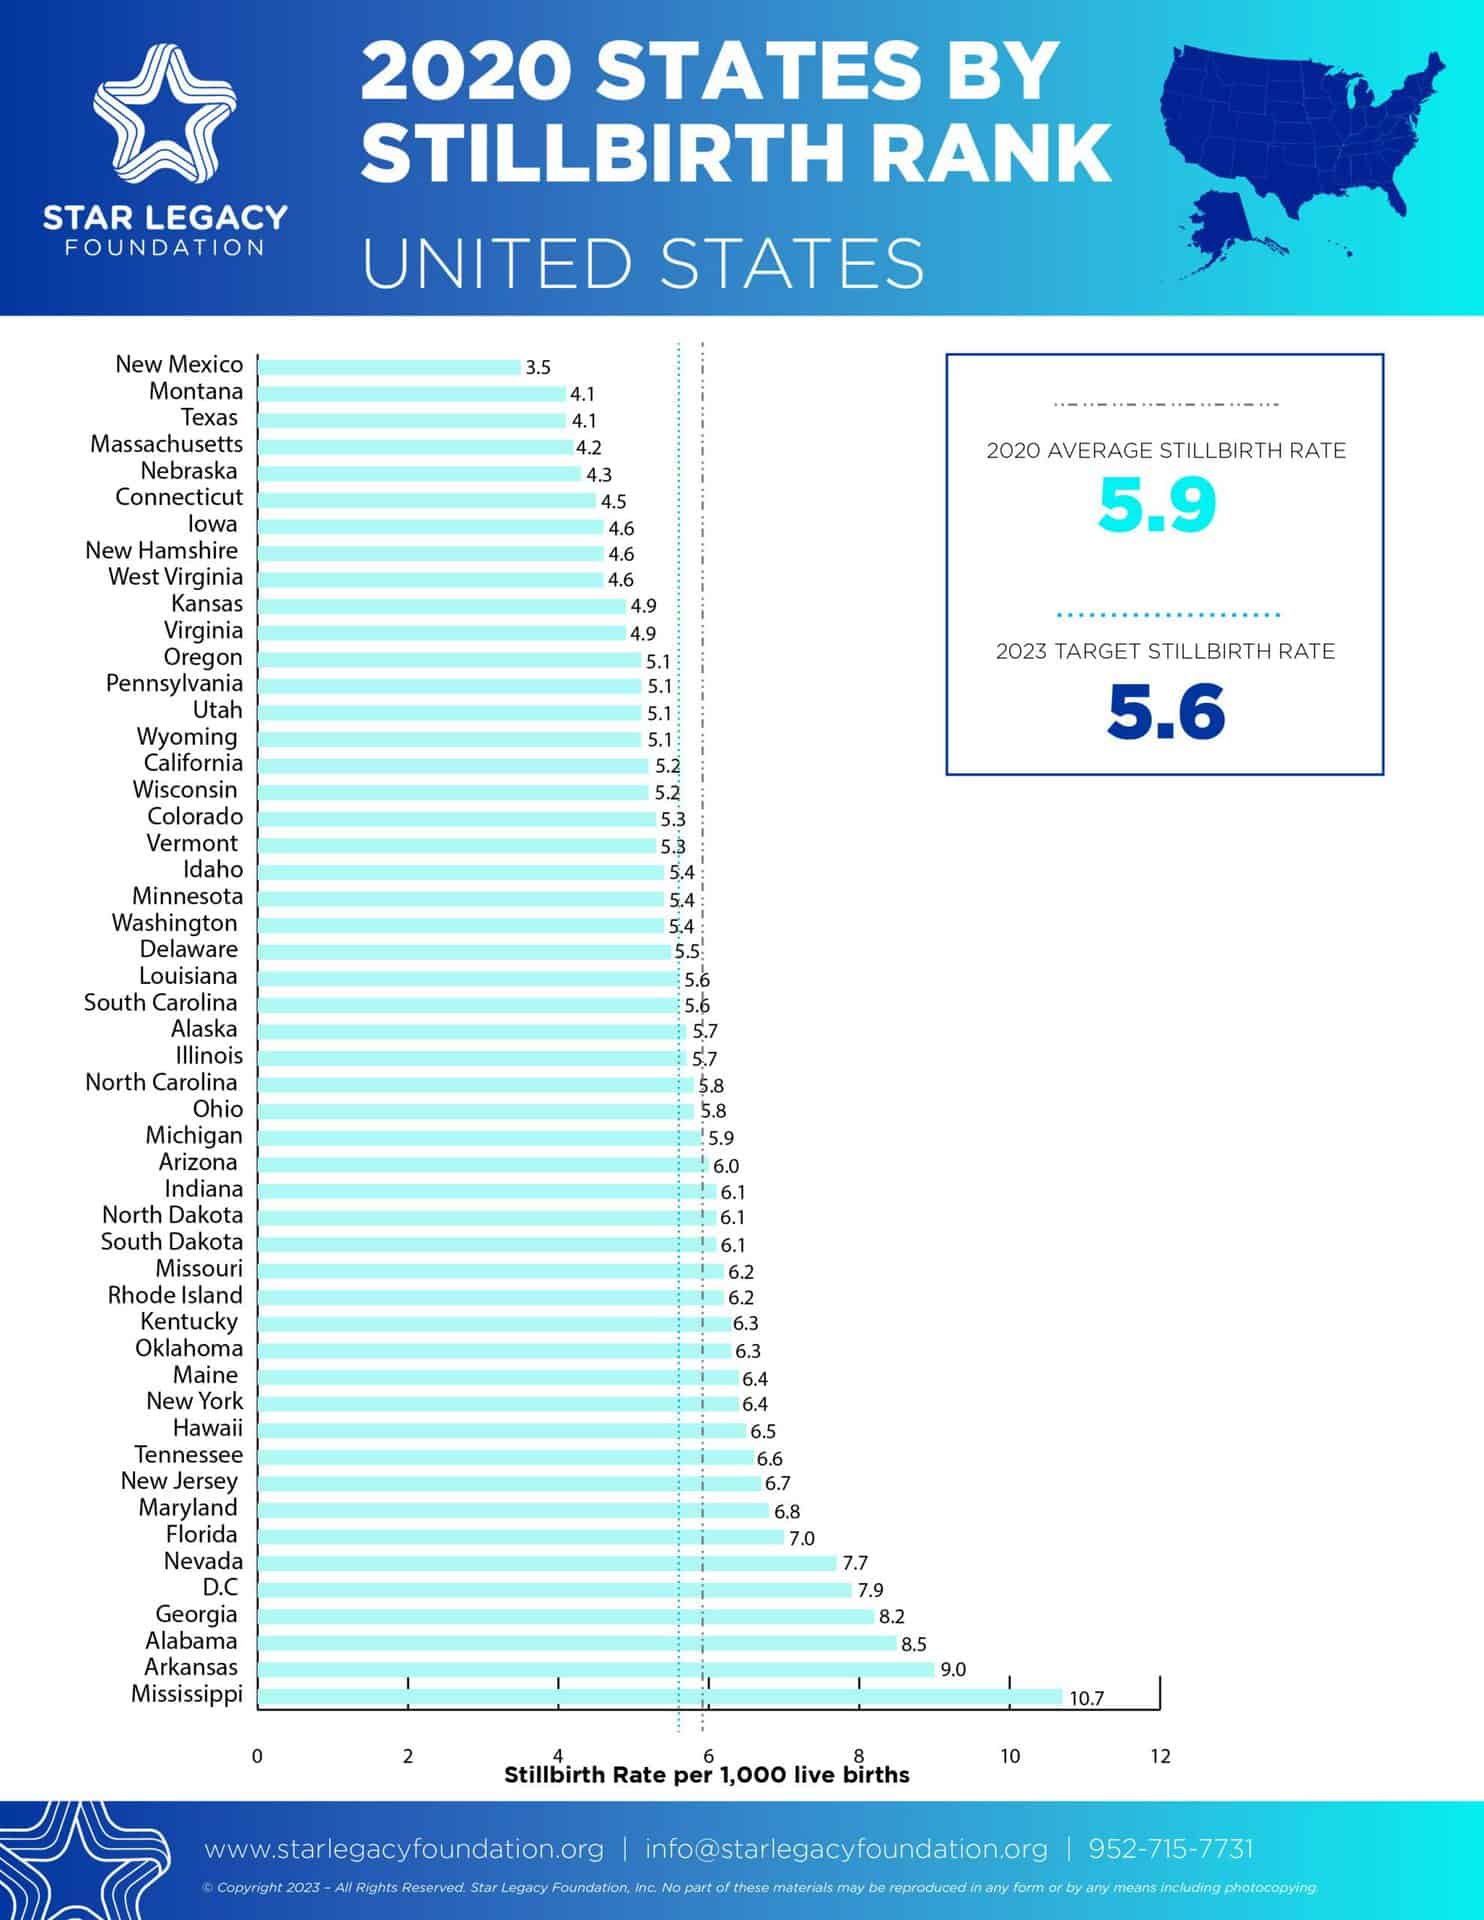
2020 US Scorecard 2020 States by Stillbirth Rate
Click on each state below for the state scorecard. Scorecard terms are defined below the map.
Scorecard Definitions
Data Sources are identified on each state scorecard and include CDC Wonder Database and individual state offices of vital statistics. CDC stillbirth data is only available through 2020. The scorecards will be updated once additional data becomes available to the public
